Mastering KPI and Financial Metric Management in Excel: The Analyst's Essential Toolkit
Excel sits at the center of almost every finance team. It is the go-to tool for tracking performance, building forecasts, and managing daily operations. While almost anyone can type numbers into a grid, managing KPI and financial metric management in Excel requires a higher level of skill. A basic user might create a simple list, but a specialist analyst builds a machine that produces insight. The gap between a basic spreadsheet and a professional financial model is wide. When models break or data loses integrity, decisions happen based on bad information. This creates risk that no business should accept. Professional analysts use specific design, formula logic, and data structure to ensure their work is accurate, scalable, and easy to audit.
Deconstructing Complex Financial Modeling in Excel
The Architecture of Advanced Financial Models
Professional models are not just stacks of cells. They function like software applications. An analyst starts by creating a clear structure. This usually includes integrated 3-statement models. These link the Income Statement, Balance Sheet, and Cash Flow statement together. When you change one input, the whole model updates. Analysts also build valuation models like Discounted Cash Flows (DCF) to find the present value of future earnings.
The secret to a great model is modular design. Build small blocks that do one task well. Then, connect those blocks. If you need to change a tax rate, you should only change it in one input cell. The rest of the model picks up that change automatically. This approach makes your work scalable. If the business grows or adds new lines of service, you can add new modules without breaking the old ones.
Leveraging Advanced Excel Functions for Financial Accuracy
Basic math is rarely enough for complex financial work. Analysts rely on a set of functions that make data manipulation safer and faster. Tools like INDEX/MATCH are superior to VLOOKUP because they are faster and more flexible when moving columns. Array formulas help perform calculations on large ranges without needing extra helper columns. OFFSETallows you to create dynamic ranges that expand as you add new data.
Error trapping is another mark of a pro. Use IFERROR around your complex formulas. If a calculation results in an error because of missing data, the model can return a blank or a zero instead of a messy #REF! or #VALUE! error. A complex depreciation schedule is a perfect example of this. You cannot just use simple arithmetic. You must use iterative logic to handle shifts in asset life or salvage value over time. Proper function combinations keep the model running even when the inputs change.
Data Structuring for Temporal and Comparative Analysis
Structuring time-series data is the backbone of any good analysis. Many users just put dates in random columns. Analysts follow a rigid structure. They use a standard date format across all sheets. This ensures that when you compare actual data to a forecast, the months line up perfectly.
Dynamic rolling periods are also vital. Instead of hard-coding a month name into a formula, create a header row that identifies the period. Your formulas should look at that header. When you move to the next month, you update the header, and your model automatically shifts to show the new data. Clean linking between sheets is the final step. Never link to a cell in a raw export. Import the data to a "Source" tab, clean it, and link your formulas to that clean data. This makes audit trails much easier to follow.
Transforming Raw Data into Actionable Key Performance Indicators (KPIs)
Defining and Calculating Core Financial Ratios
Numbers alone do not tell a story. You need context to know if a figure is good or bad. This is where ratios come in. Analysts calculate liquidity ratios to see if a company can cover its short-term debt, like the Current Ratio. They look at profitability ratios, such as Return on Assets (ROA) or Return on Equity (ROE), to see how well management uses company resources.
Efficiency ratios, like Inventory Turnover, show how fast a company sells its goods. Every ratio needs a clear definition. If you calculate a margin, state exactly what cost components go into it. Do not just drop a percentage on a screen. Tell the reader what the number means and why it changed from the last period.
Building Dynamic Dashboards for Executive Insight
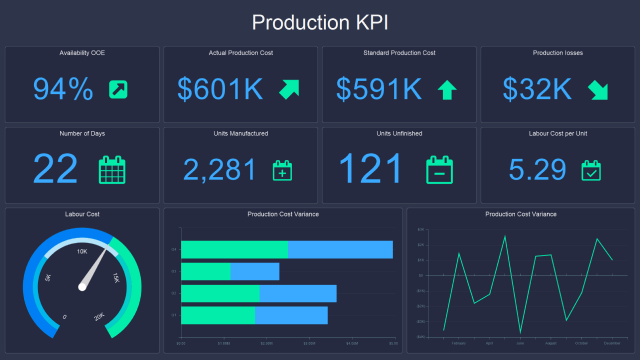
Executives do not want to see 50 tabs of raw data. They want a clear view of the business. Analysts use visualization tools to make data simple. PivotTables are the core of this work. They summarize massive datasets in seconds. Slicers add an interactive layer. A user can click a button to change the view from a specific region to the whole company.
Sparklines add a quick trend view in a single cell. Conditional formatting is useful for heat maps. You can color-code cells to show red for a miss and green for a hit. Before you link any dashboard to source data, set strict data governance rules. Ensure that every source is clean and formatted the same way. If the data quality is poor, your visuals will be misleading.
Variance Analysis and Scenario Planning Capabilities
Comparing what happened against what you planned is the core of financial control. This is variance analysis. Analysts structure their models to show the Budget vs. Actuals (BvA) for every line item. If the variance is large, the model should flag it automatically.
Scenario planning is just as important. A business needs to know what happens if sales drop or costs rise. Analysts use data tables to run "what-if" scenarios. You create a toggle switch in the model. One setting shows the "Base Case," another shows the "Worst Case," and a third shows the "Best Case." This gives management a range of outcomes rather than just one guess. It helps the business prepare for the unexpected.
Ensuring Data Integrity and Auditability in Analytical Workbooks
Establishing Robust Data Validation Protocols
A model is only as good as its inputs. If a user enters text where a number should be, the whole model breaks. Use Excel’s Data Validation tool to stop this. You can limit input cells to only allow numbers within a certain range. This prevents fat-finger errors.
Protecting your work is also critical. Lock the cells that contain formulas. Leave only the input cells unlocked. This allows users to run scenarios without risking the logic of your model. If a user cannot touch your formulas, they cannot accidentally break your calculations.
The Importance of Traceability and Documentation
A good analyst builds models that other people can understand. If you leave the company, your successor should be able to open your file and know exactly how it works. Document every assumption. Use the comment feature or a dedicated "Assumptions" tab to explain where your data comes from.
Link your logic clearly. If a formula refers to another sheet, give that sheet a clear name. Explain why you used a certain growth rate or cost driver. Many analysts adopt standard modeling guidelines, like keeping all inputs in one color and all hard-coded numbers in another. This visual code makes the model easy to audit.
Managing Large Datasets: From Raw Export to Analytical Ready
Sometimes, you have to work with huge datasets that make Excel slow. Do not copy and paste millions of rows. Use Power Query. It is a tool inside Excel designed to connect to outside data. It can pull data from a database, clean it, filter it, and load it into your model.
Power Query acts as a repeatable process. Once you set it up, you just click "Refresh" to get the latest data. It handles the heavy lifting so your Excel file does not lag. It keeps your raw data separate from your analytical data, which is a best practice in data management.
The Specialist Analyst Advantage Over General Users
Financial Modeling vs. Data Entry: Distinguishing Roles
A general user sees Excel as a calculator. A specialist analyst sees it as a business driver. The difference is domain knowledge. An analyst knows that the Income Statement follows certain rules. They know how to account for non-cash items.
When an analyst builds a model, they think about the business logic first. They ask, "Does this result make sense given the current economic climate?" A general user might just accept the output of a formula without checking if it is realistic. The analyst brings a professional standard to the numbers.
Time Efficiency Through Template Optimization
Analysts hate doing the same work twice. They build templates. If a report is due every month, an analyst creates a file that handles 90% of the work. They set up the data connections and the logic so that the next month is a quick update.
This turns a two-day manual project into a one-hour task. It removes the chance of human error. It also gives the analyst time to do what they do best: look for trends and insights rather than just pushing data around.
Interpreting Metrics Beyond the Numbers
The final, and most important, step is the "why." A general user reports that EBITDA went down. An analyst explains why. They look at the drivers behind the change. Was it a drop in volume? Did raw material costs spike?
They connect the operational performance to the financial outcomes. They can tell management, "We missed our margin target because of higher shipping costs, and here is how we can fix it." This is how an analyst adds value. They turn a spreadsheet into a strategic asset.
Securing Future Financial Agility Through Expert Excel Management
KPI and financial metric management in Excel is more than just knowing functions. It is a discipline. It requires a mix of technical skill, logical structure, and deep business knowledge. Organizations that treat Excel like a critical business tool are the ones that succeed. They invest in the people who know how to build models that last.
To get the most out of your financial reporting, focus on these areas:
Standardize your design: Use consistent structures and modular logic.
Automate the data process:Use tools like Power Query to cut out manual entry.
Prioritize auditability: Keep formulas clean and document all your assumptions.
Focus on the story: Use the models to find the "why" behind the numbers, not just the "what."
When you get the technical side right, you gain the freedom to think about the business. That is the true value of an analytical approach to Excel.
Subscribe to our Articles: